
Building a Data Model: A Step-by-Step Methodology for Analytics Engineers

Article key takeways:
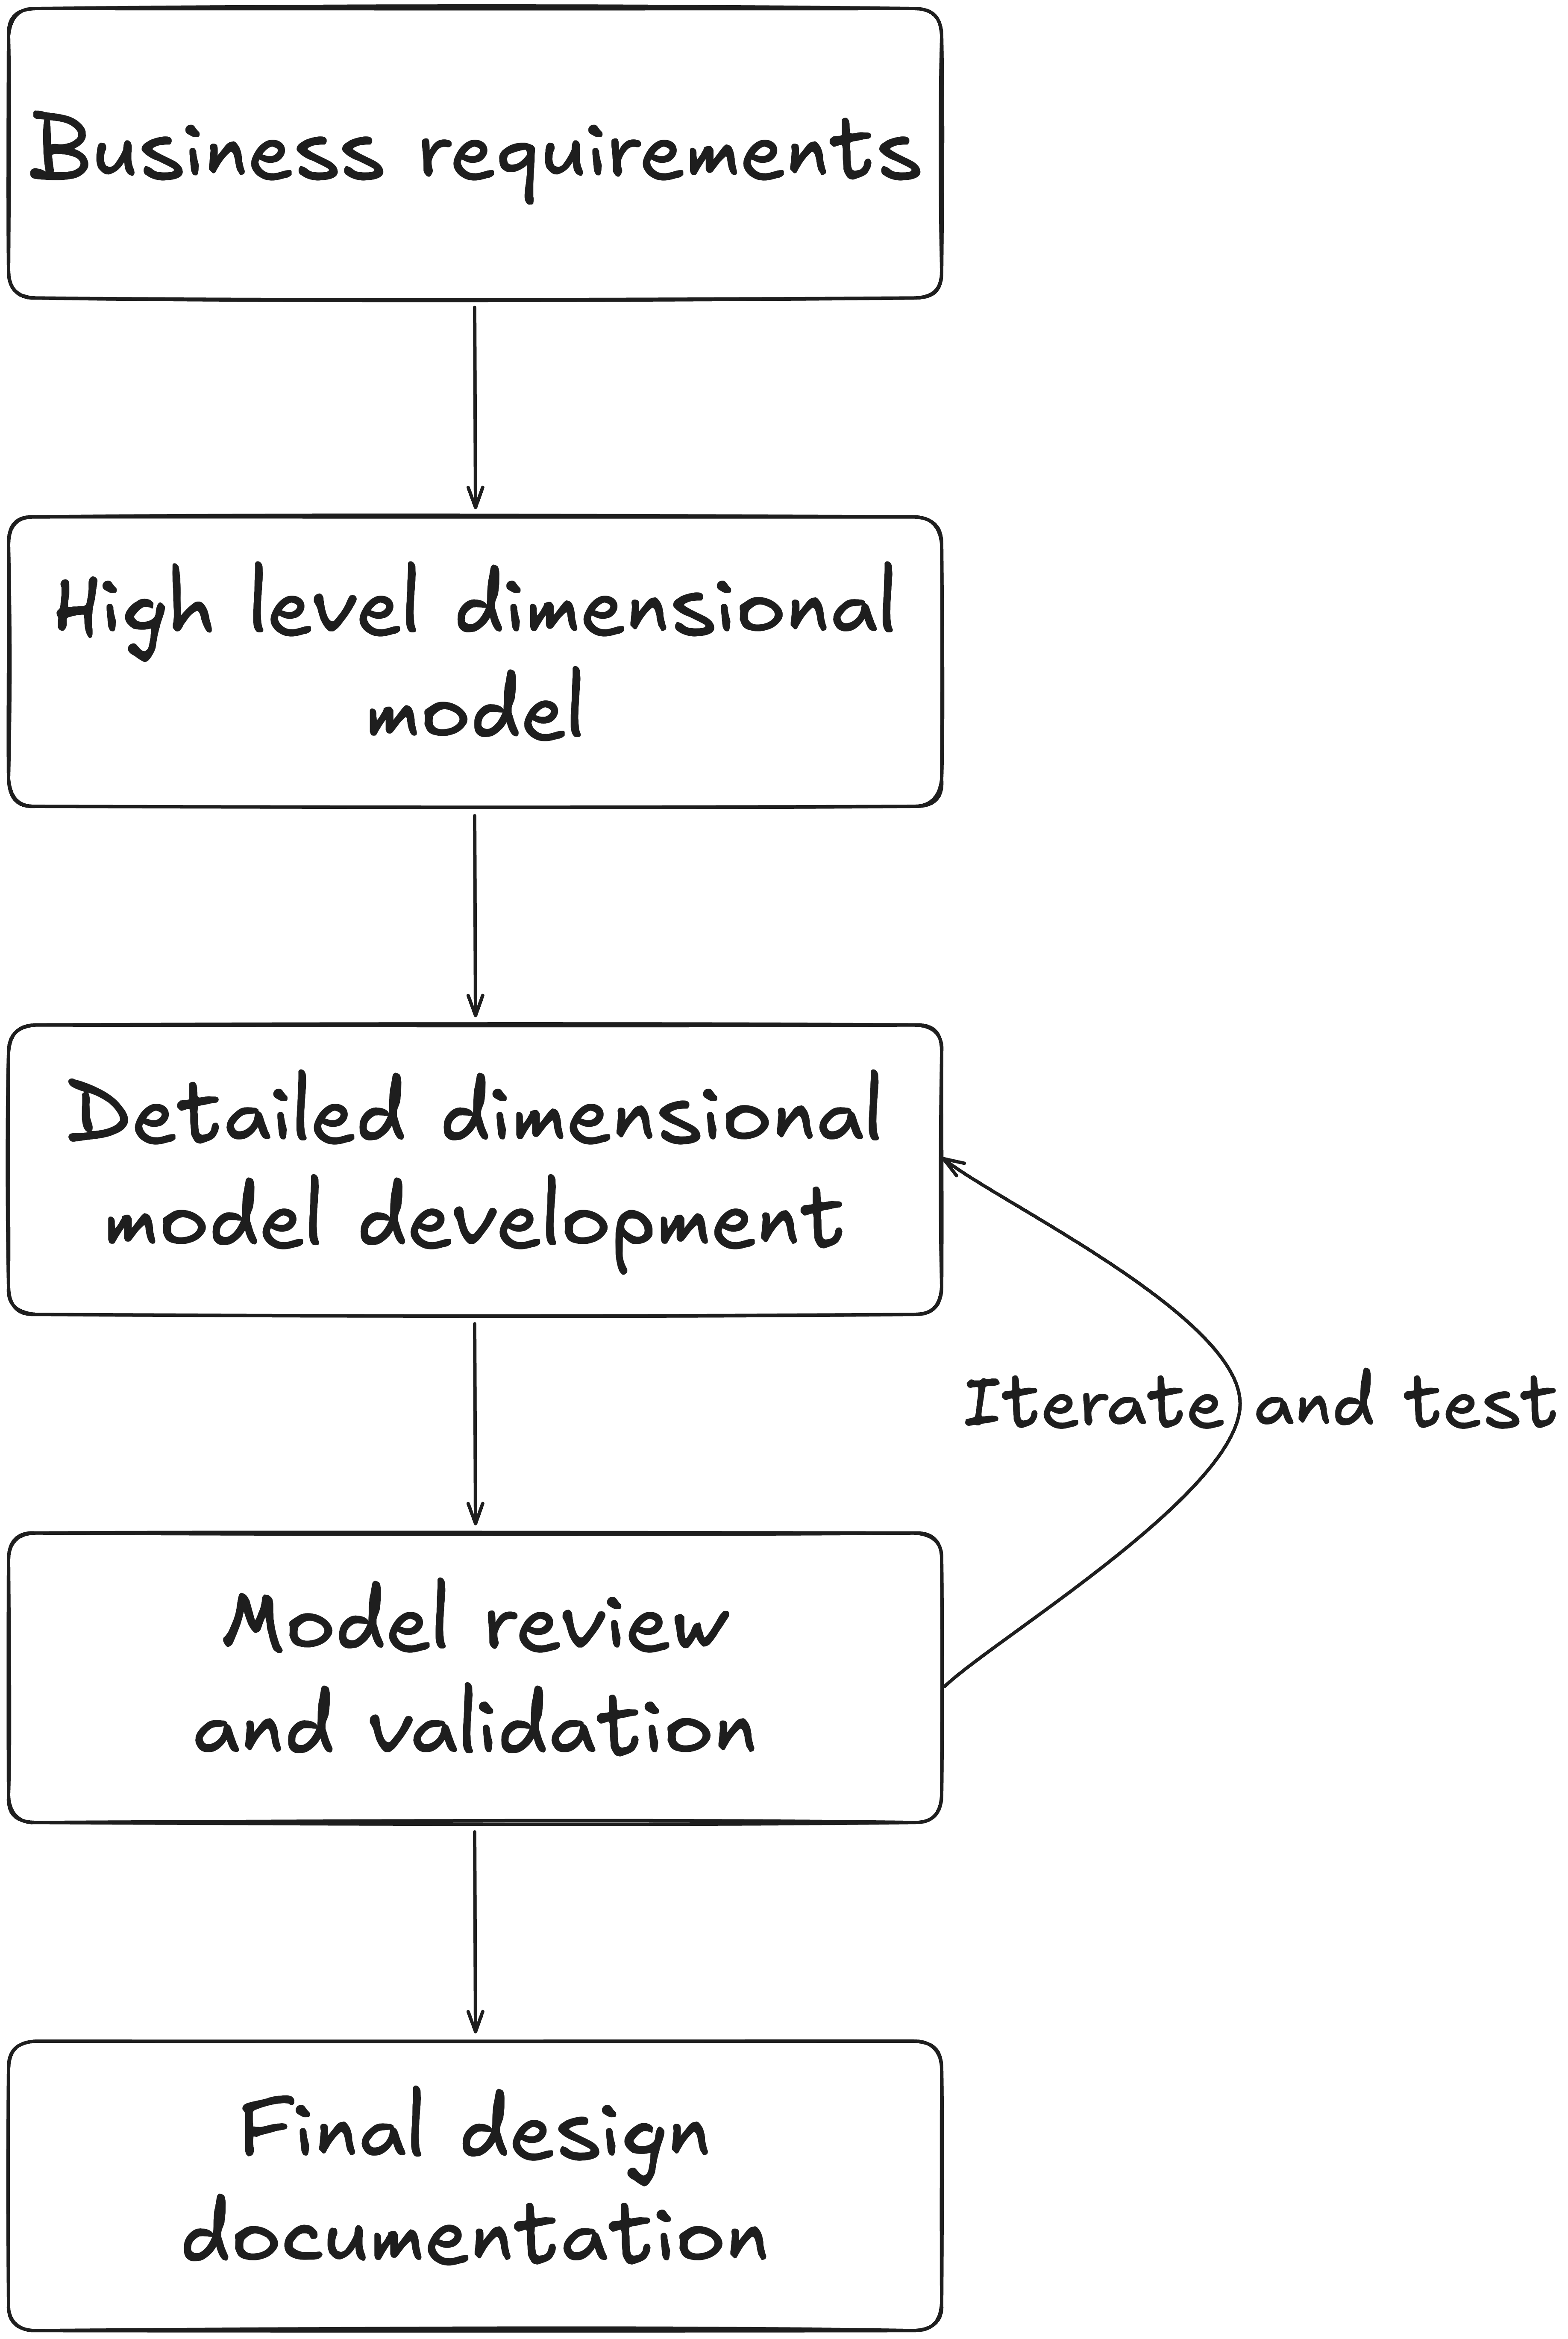
The 5 steps to build a data model:
Business requirements
→ Output: understand your business stakeholders needHigh-level dimensional model
→ Output: a data model schema done with tools like dbdiagramDetailed dimensional model development
→ Output: an Excel file with a detailed description of the tables you’ll implementModel review and validation
→ Output: back and forth with business stakeholders to fix feedback from them (at that stage, they should have tested your implemented tables)Final design documentation
→ Output: A final documentation, on Confluence for instance, describing your work so that anyone could understand it
In my previous article, I talked about the most used data modeling methods in industry. In this one, I aim at giving you a clear and easy methodology to follow up when you’ll have to build a data model for your company. I’m writing in the perspective of the most used data modeling approach used: Kimball’s dimensional modeling.
The 5 steps to pursue are the following:
Business requirements
This step is by far the most important! A rule you should keep in mind is that the best data layer an analytics engineer (AE) can build comes from:
A very narrow collaboration with business teams
Simplicity in the data modeling for long-term robustness
You should find the subject matter experts from the business to actively collaborate, understand their business needs, the data they need for their use cases. They are important because they are the individuals who have historically figured out how to extract data from source systems and turn it into valuable analytic information.
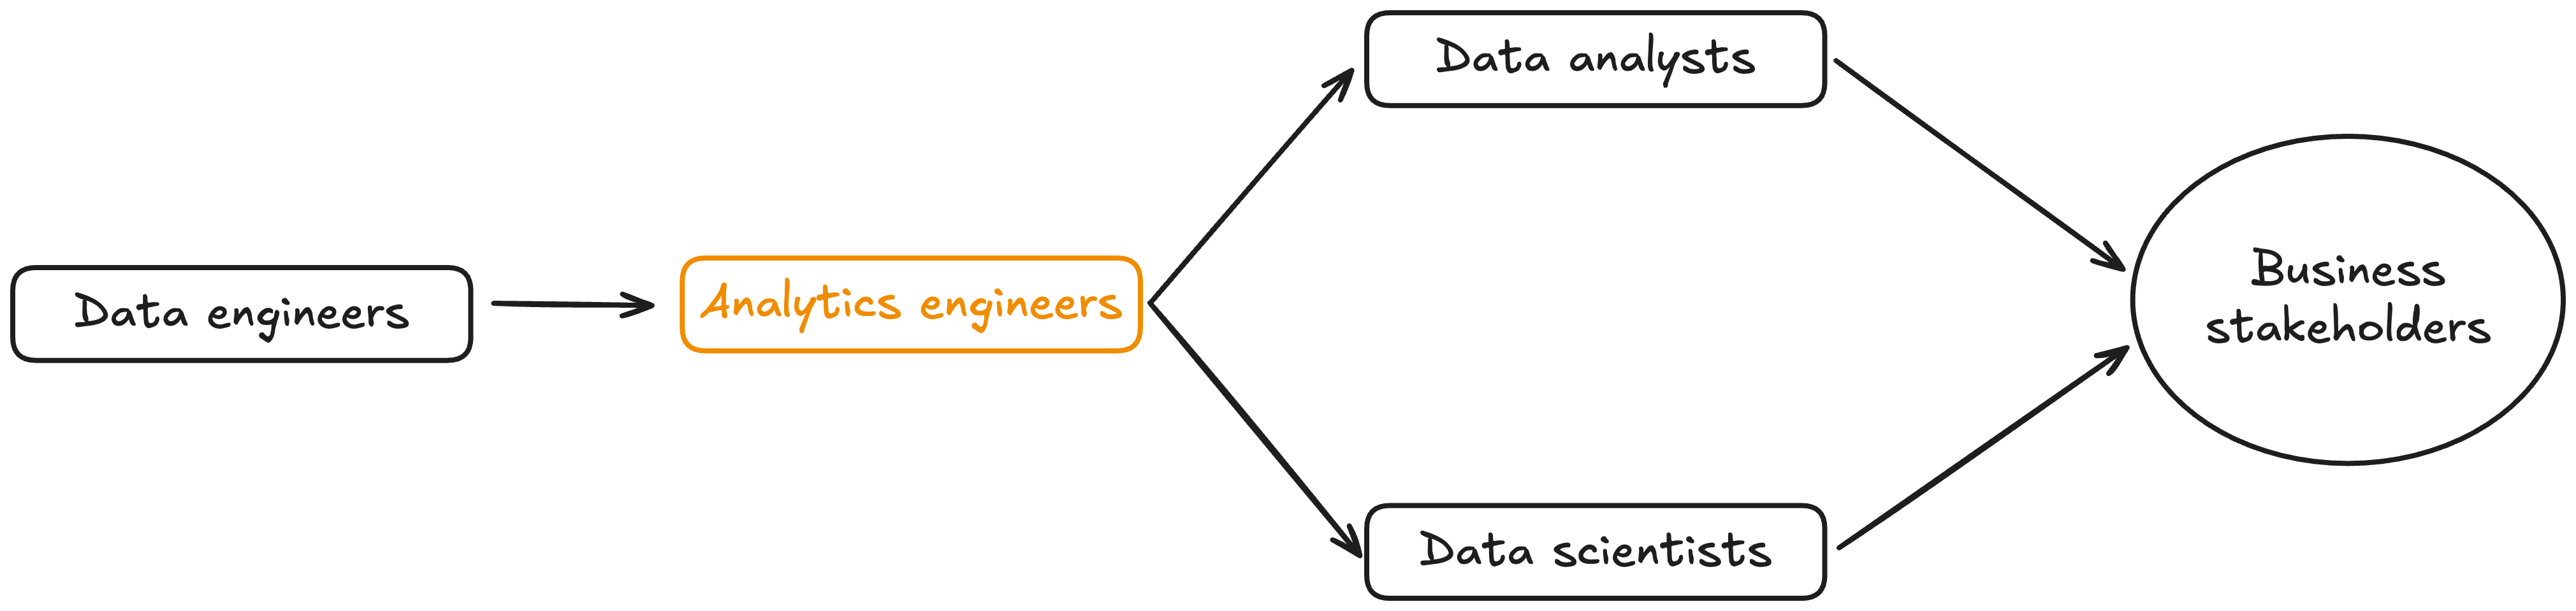
As an analytics engineer, your team structure should look like in the schema shown below. Basically, data engineers which extract and load data into your cloud provider. You, the AE, who is transforming data to obtain a business-oriented data layer. Then, data analysts and scientists which build analytical (dashboards) and AI products, respectively. They are the closest to business stakeholders.
If your data analysts and scientists are in your company from a long time enough to have gained a lot of business knowledge, the best would be to reach out to them to understand the business requirements of stakeholders. You should do it through meetings and workshops where you ask which data they’re using to tackle the use cases they have, ask for the meaning of the data they use, which data source do they use and why. This does not exclude from having discussions with business stakeholders straight but it minimizes the priority of doing so. However, if your data team is small or data analysts, scientists or product owners do not have enough business knowledge, then you have to ask for the business experts, organise meetings and workshops so that you understand their needs, their priorities, what they looking for.
You should come out of that part with answers to these extremely important questions:
What are the current main priorities of my company therefore of my business stakeholders ?
How the data layer I’ll build as an AE will align to these priorities so that my work gets the most recognition as possible ?
High level dimensional model
Once you’ve discussed with the business, you should translate your understanding into a data model that will address 80-90% of your team’s analytics use cases.
To design your dimensional model, you should follow these 4 steps:
Identify the business process → this is basically the department you’re working in most cases (sales, HR, finance, …)
Declare the granularity of the business process
Identify the facts
Identify the dimensions
Let’s say you’re working in the sales department at Apple, and you’re in charge of building the data mart that will serve as the source for all future analytical use cases. In this case, your 4 steps would be:
Identify the business process → Sales
Declare the granularity → to make sure that you can tackle any use case, the best is to start at the most granular level. In this example, you’ll decide to work at the transaction level meaning one row will define a single transaction for a single product at a given time
Identify the facts → closely related to the last point. Facts are events which took place in real-life. In this case, the events are the transactions taking place at Apple offline (in store) and online (digital channels)
Identify the dimensions → As I talked about in my previous article, dimensions are attributes to the facts. They are meant to answer these questions: who, what, where, when, how and why
Who bought an Apple product ?
What was bought by the customer ?
Where did the transaction take place ?
When did the transaction take place ?
How did the customer pay ?
Why did the customer buy this product ?
The output of that step should be a data model schema done with tools like dbdiagram:

Lastly, you need to present your star schema to the people who will use your data layer (data analysts and scientists). You have to aim at reaching a consensus with the different stakeholders so that you’re sure that your data model is correct. You have to organise meetings with the different stakeholders so that you let everyone know about your work. Do not overlook the communication part ! It is very important to communicate, let people know what you’ve been working on and how you came with a solution to ease your colleagues’ professional life.
Detailed dimensional model development
At this stage, you should use your data model schema as shown above to dive deeper into a more detailed description of the dimensional model. At this stage, you should prepare an Excel file with a detailed tab for each table.
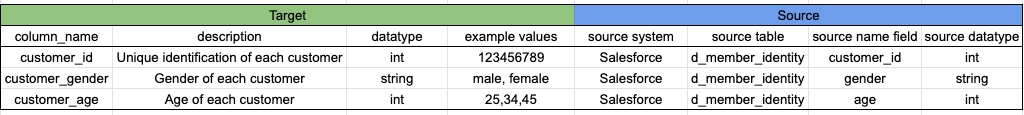
The output of this step should be an Excel file with a single tab for each table, containing detailed information about every column. In case of the star schema shown above, I’d prepare an Excel file with 7 tabs (as there are 7 tables). In each tab, I’d describe every column with information related to the final table alongside its source. For instance, for dim_customer, the Excel tab would look like:
Model review and validation
At that stage, you’ll start implement what was written in your Excel file. This Excel will guide you through your development. Once you’ve developed a table, you need to make some basic tests (total number of rows, content of table, correct implementation of functional rules,…). Once you’ve done these basic tests, send the table to data analysts, data scientists, or business stakeholders for testing. In most cases, you’ll have some back and forth with your colleagues to fix the different issues.
My advice is that you have to listen to your colleagues, about their feedback once they’ve done some tests. Stay open-minded and remember that these tables need to be used by data analysts and scientists for business stakeholders. If you don’t listen to their feedback and react accordingly, no one will use your data or you’ll have some strong lack of confidence issues. Take this step very seriously, even if it requires more time. It’s better to take more time on that step to make sure everything aligns with you user’s will rather than delivering something which won’t be used.
Final design documentation
Once you’ve developed all the tables, addressed feedback, and ensured that tests went well, you can finalize the documentation for your data model. Ideally, you should have started documentation along the way. If not, no worries—add all the schemas you’ve created and the Excel file. This would serve as a great starting point.
Sources: