
Demystifying Data Modeling: Which Approach is Right for Your Business?

Article key takeways:
Best data modeling approach to implement as an analytics engineer
→ Kimball dimensional modeling with star schema alongside One Big TablesKimball dimensional modeling
→ most widely used in industry
→ bottom-up denormalization approach
→ introduced star schemaOne Big Tables
→ fully denormalised extreme
→ cheaper for compute but more expensive for storage compared to star schema
→ complementary with a fully normalised star schemaInmon approach
→ top-bottom fully normalised approach
→ best solution on paper but hard to put in place in real-world use cases
Kimball dimensional modeling
Takeaways:
bottom-up approach → from business areas to Enterprise Data Warehouse
denormalization approach at the company level
star schema as the central piece of Kimball data modeling
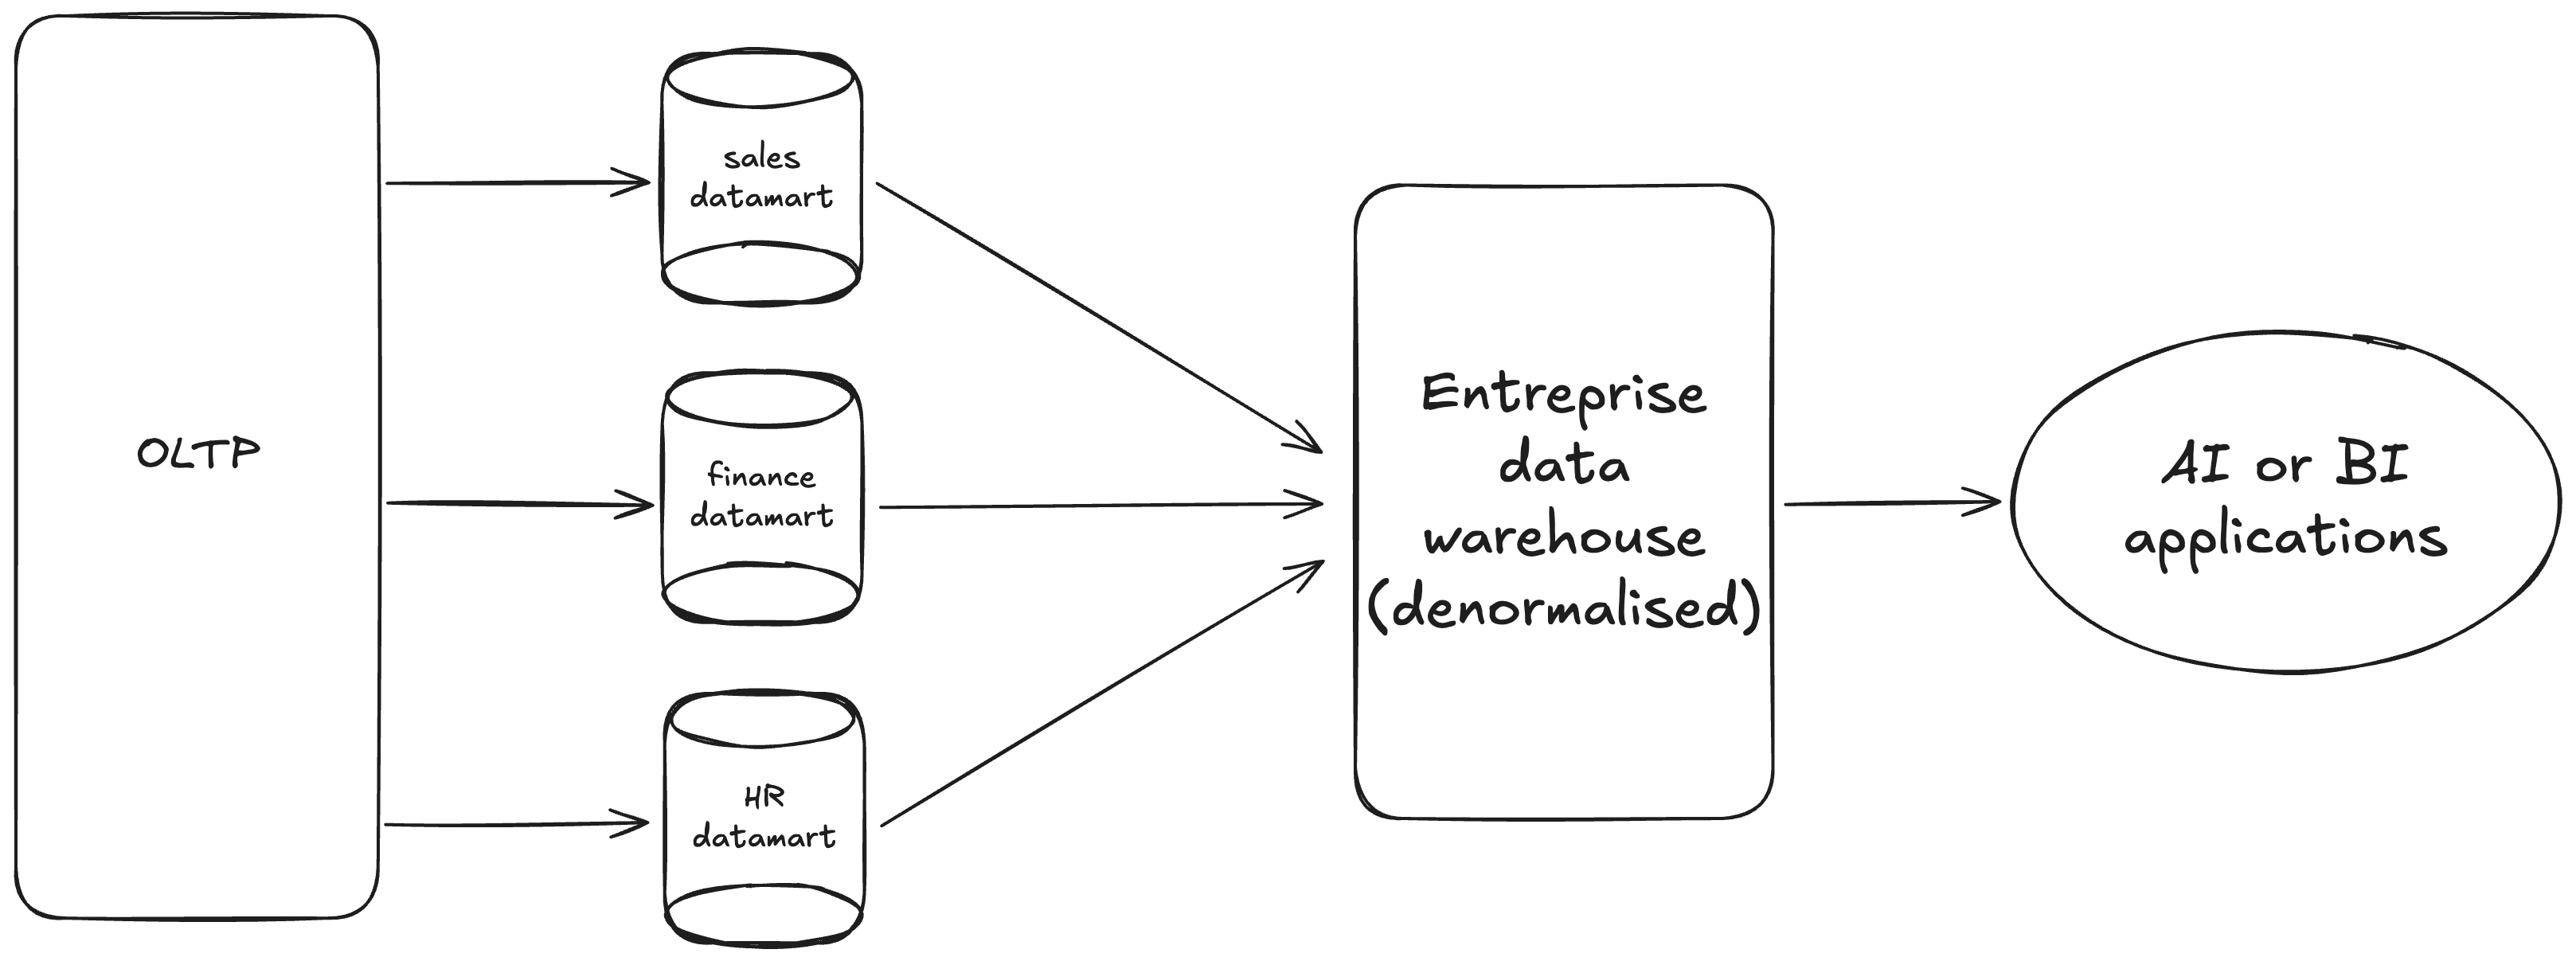
Kimball dimensional modeling, introduced by the well-known Ralph Kimball in 1996 through his book “The Data Warehouse Toolkit”, is the most widely accepted approach for presenting information in data warehouse systems. As shown in the schema below, the core of this approach is to build data marts for each business area (sales, marketing, finance, HR, …) based on data taken from OLTP (Online Transaction Processing) systems. These business-oriented data marts constitute the Enterprise Data Warehouse (EDW). By building independent data marts first and then combining them to get the EDW, we touch a crucial concept in Kimball dimensional modeling: denormalization (having data redundancy i.e data can be present in different places across the company). Indeed, Kimball’s approach promotes denormalization as it is easier to build an EDW this way without having to make sure that any given data is only present once in the entire company. From the EDW, AI or BI applications can be developed and treated.
A caveat here is that with this “classic” data warehouse architecture, AI applications would be quite limited. Machine learning use cases could be tackled but no advanced topics like Computer Vision. For these more advanced topics, a data lakehouse is more suitable, I’ll talk about datalakes and data lakehouses in future articles.
The game-changer topic which was introduced with the Kimball dimensional modeling was the star schema. The star schema allows to schematically organise your data (a schema that looks like a star !) so that you are able to answer pretty much any business question you’d have about your company’s events. The center piece of a star schema is a fact table which will gather raw events which took place such as transactions, applications logs, and so on. According to Ralph Kimball’s book The Data Warehouse Toolkit, “the fact table in a dimensional model stores the performance measurements resulting from an organization’s business process events”. Surrounding your fact table are dimensions which are attributes of your fact table. Basically, it contextualize the events which were stored in your fact table. According to Ralph Kimball’s book, dimension tables “describe the ‘who, what, where, when, how and why’ associated with the event”.
Using the schema below, let’s say, you went to Apple Palo Alto to buy the iPhone 16 pro on BlackFriday, Friday November 29th 2024 for a total cost of $600 noting that you paid by credit card. That’s the event and you’d like to be able to reconstruct that event using Apple’s data. To do so, you could use a star schema as shown below where:
fact_sales stores your transaction
Who ? dim_customer gives point at you being the customer
What ? dim_product gives the product bought (iPhone 16 pro)
Where ? dim_store gives the location (Apple Palo Alto)
When ? dim_date gives the date (Friday, November 29th 2024)
How ? dim_payment_method explains how you pay (by credit card)
Why ? dim_promotion explains that you bought that iPhone on Black Friday to get a discount


One Big Tables (OBT)
Takeaways:
OBT is an outcome of a star schema → fully denormalised table
Cheaper as for compute but more expensive as for storage compared to star schema
If used wisely, complementary with star schema → thumb rule: star schema answers 80-90% of business use cases and OBT answers 10%
Having a normalised star schema is very efficient as it allows to answer most business use cases, especially when the fact table is at the finest granularity (e.g one row per transaction). However, if your data layer is composed of only a star schema, it can be expensive to provide data for every analytics use case as you’d have to make joins between fact and dimension tables. Here is where OBTs come in.
A One Big Table (OBT) is the outcome of a star schema where you’re building a big denormalised table where you’re crossing your facts with dimensions so that you have an already built table which could answer your business use cases without having to build anything. As an analytics engineer, an OBT is the table your data analysts and data scientists would query first to see if it has necessary information to answer their use cases. This makes an OBT cheaper to use than a star schema as you don’t have to join tables. It saves money on compute but storing an OBT is more expensive than storing the star schema.
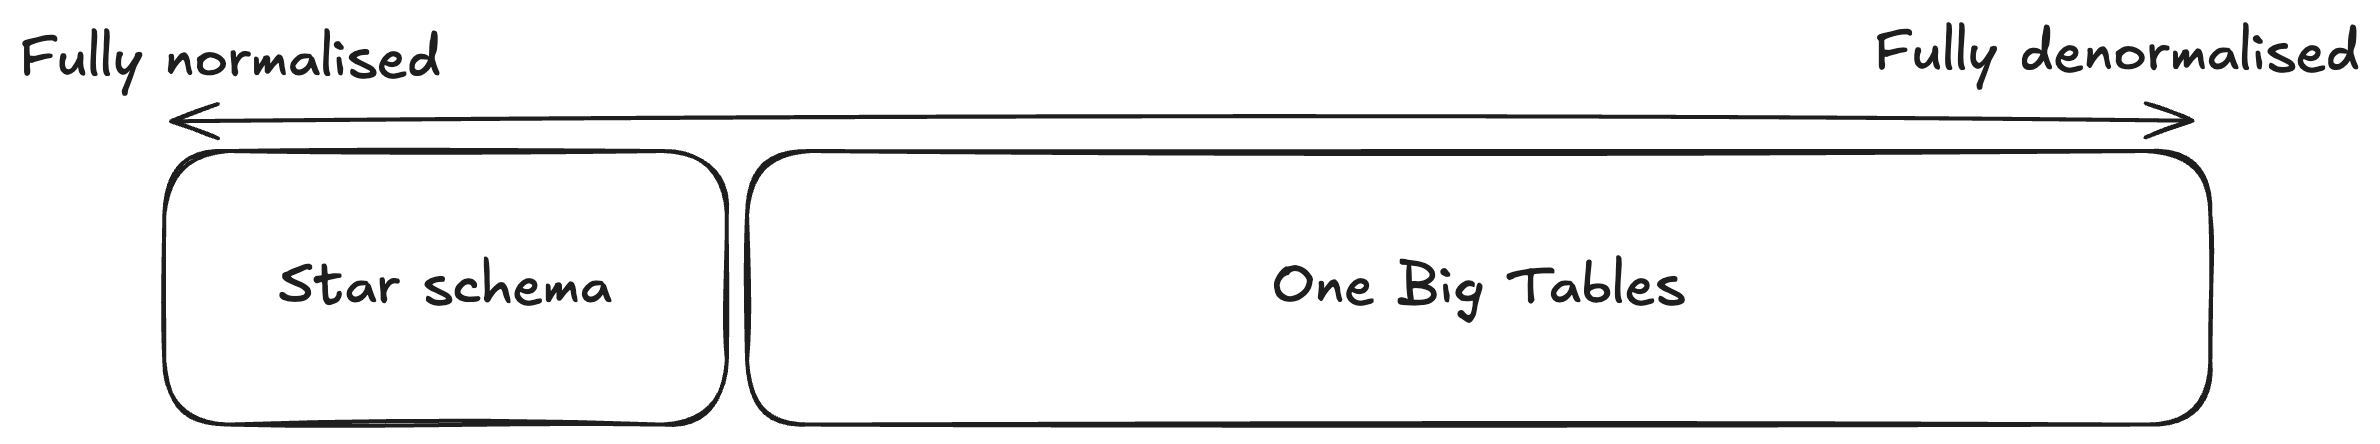
OBT are not the opposite of star schema. Rather, they are complementary. To get the best data layer as a back-end of analytical use cases, having a normalised star schema alongside partially denormalised tables down to a highly denormalised OBT ensures that you’d be able to answer all your use cases. As a rule of thumb, an OBT answer 10% of analytical use cases and a star schema, 80-90% of use cases:
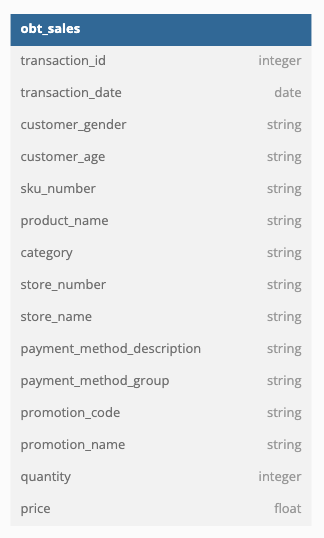
Reusing the star schema I showed above, the outcome OBT would look like:
Inmon data warehouse approach
Takeaways:
top-bottom fully normalised approach
best solution on paper but hard to put in place in real-world use cases
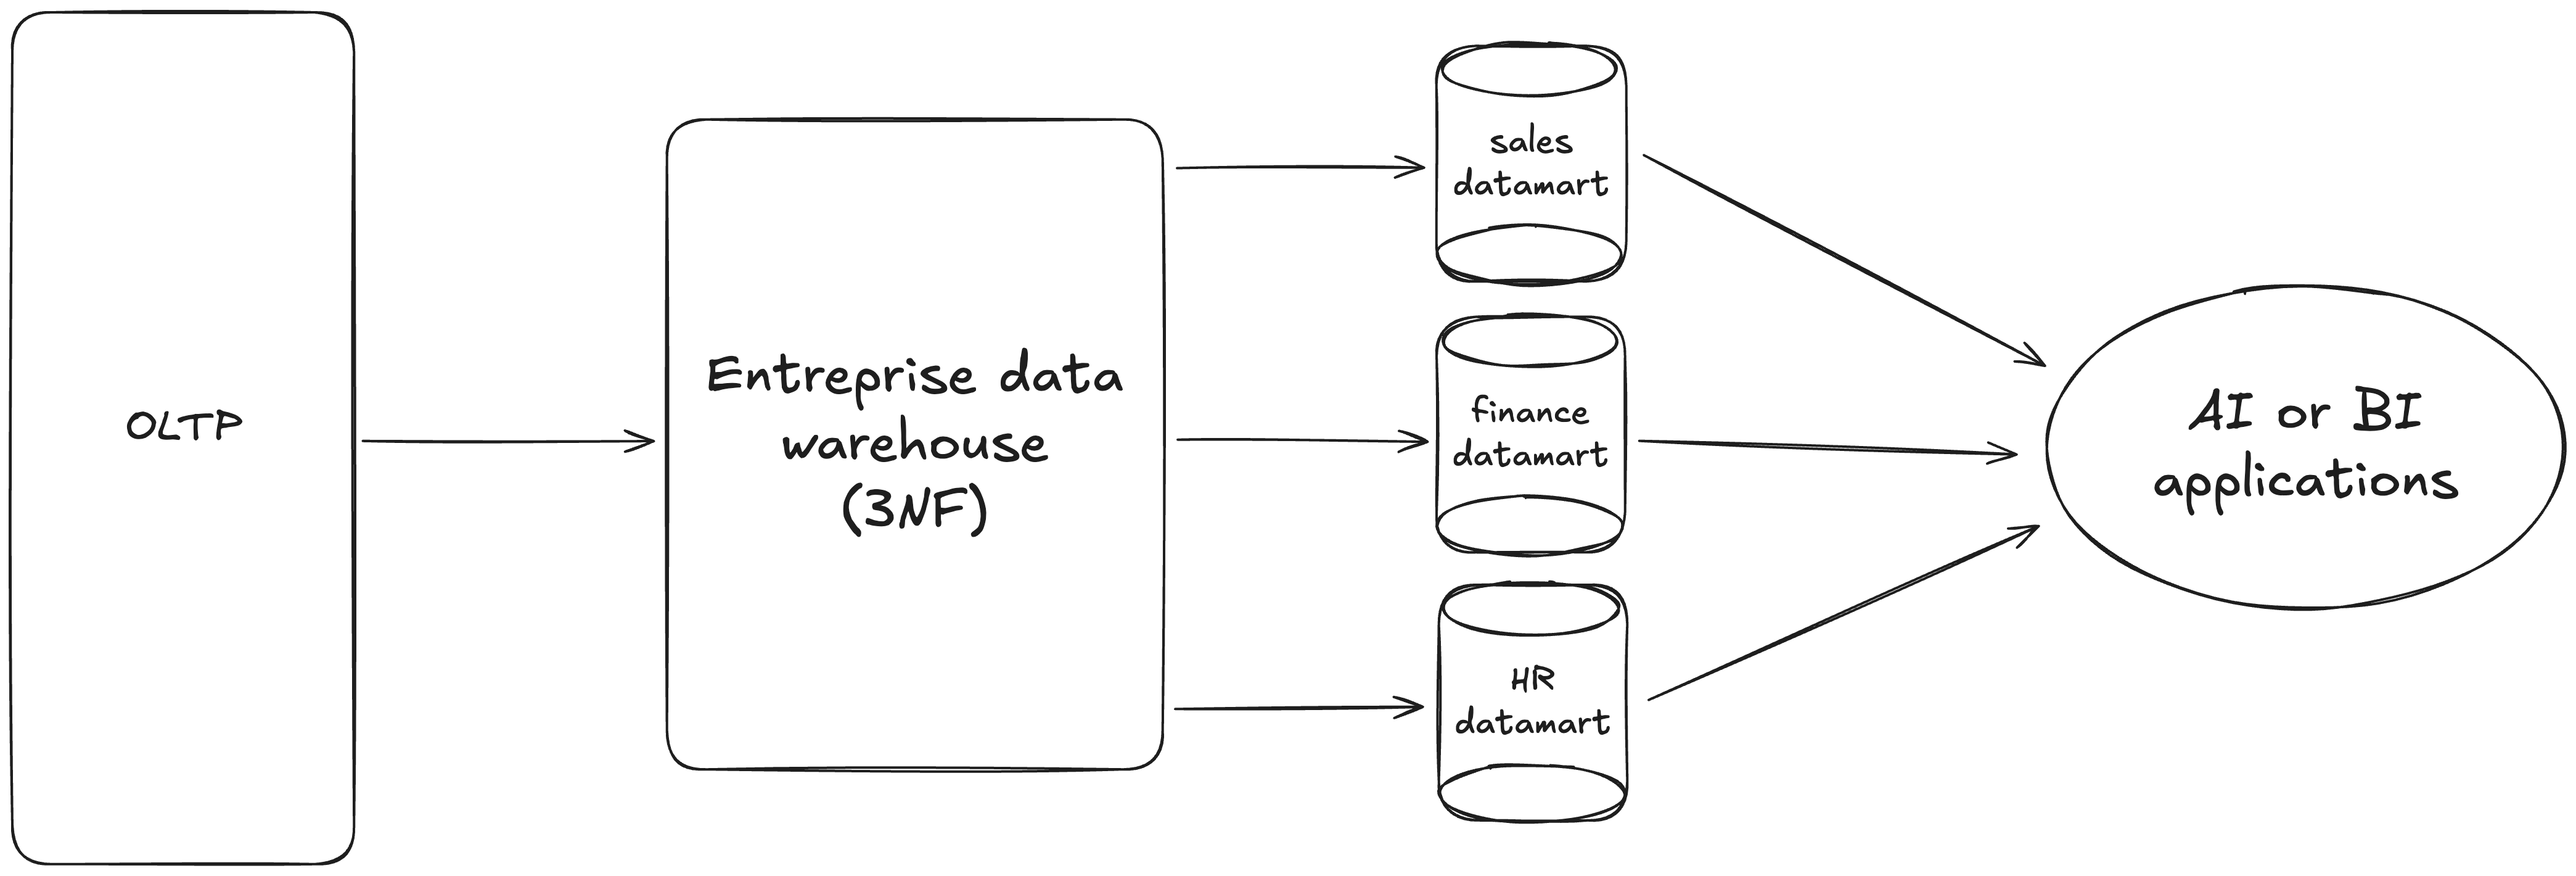
Inmon’s approach was introduced by Bill Inmon known as the “Father of data warehousing” in 1992 through his book '“Building the Data Warehouse”. As shown in the schema below, the core of this approach is to build an Enterprise Data Warehouse (EDW) from OLTP systems. The purpose is to fully normalise the EDW that is to say, ensuring no redundant data at the company level. Once the EDW is built, data marts are created to serve specific business needs or departments. From these data marts, AI or BI applications can be done. The purpose of this approach is to provide a single, consistent source of truth for all use cases across the organisation.
Which approach is right for you ?
Takeaways:
Kimball dimensional modeling with star schema alongside One Big Tables
Compared to Kimball’s data modeling, the Inmon approach is top-bottom as there is a first focus on the higher company level then there is a drill down to business processes or departments. Inmon’s approach is much less used than Kimball’s in industry because it is more complex to implement and requires more time before being able to deliver business-driven analytics solutions. Moreover, Kimball’s modeling is optimised for querying and analysis compared to Inmon’s which require further aggregation. Moreover, in real-world, using a business-focused approach (Kimball) is very often a better solution than using an enterprise-focused (Inmon) one.
So, compared to Inmon’s, Kimball’s data modeling is the best and easiest approach to adopt.. However, having a normalised star schema for each business process is a very good starting point but it can become expensive if you have to join tables for a vast variety of use cases. Here, OBTs come in. The best way would be to mix these two approaches where OBTs are the first tables which can be checked for analytics use cases. They should answer 10 to 20% of use cases. If they don’t, then, star schema can be used. As shown below, the purpose is to be able to fill the full normalisation scale with fully normalised fact and dimension tables on an extreme, fully denormalised OBTs on the other extreme and partially denormalised tables in between. I’ll talk about that in another article: to achieve this adding Medallion architecture with Kimball’s star schema and OBTs allow to get to that.
Caveat: In the industry, Kimball approach is widely used but be careful as there is a misunderstanding of Kimball approach and star schema. A star schema is an output of Kimball dimensional modeling, widely used wherever data modeling is applied. However, it is not because you’re implementing a star schema that you’re working under the Kimball approach. Within Inmon approach, to build the data marts, star schema can be used !
Sources: